Windows displays a Blue Screen of Death when fatal system errors occur. Minidump files preserve crash data for detailed analysis. Reading BSoD minidump files enables precise identification of root causes and effective troubleshooting.
The Blue Screen of Death signals a kernel-level failure in Windows. Driver conflicts or hardware malfunctions typically trigger this error. Standard applications rarely cause BSoD events since they operate at user level. When a crash occurs, Windows generates a minidump file containing memory snapshots for debugging. Analyzing this file reveals the underlying issue. Therefore, reading BSoD minidump files is essential for system recovery.
Default minidump storage locations: %SystemRoot%\MEMORY.DMP or %SystemRoot%\Minidump. Free utilities like Windbg Preview and BlueScreenView can parse these files effectively.
Understanding Minidump Files in Windows Systems
A minidump file captures a condensed snapshot of system memory during a crash. It is significantly smaller than a full memory dump. This compact size facilitates easier sharing and faster analysis. However, minidump files still contain critical debugging data. Key information includes error codes, parameters, and involved modules. Thus, reading BSoD minidump files serves as the foundational step in system diagnostics.
Effective minidump analysis requires basic knowledge of Windows architecture. Technicians must recognize relevant system drivers and modules. Moreover, professional gamers can leverage this analysis too. They frequently encounter crashes during demanding gaming sessions. By reading BSoD minidump files, they can optimize system configuration. Consequently, gaming performance becomes more stable and reliable.
Reading BSoD Minidump Files with Windbg Preview
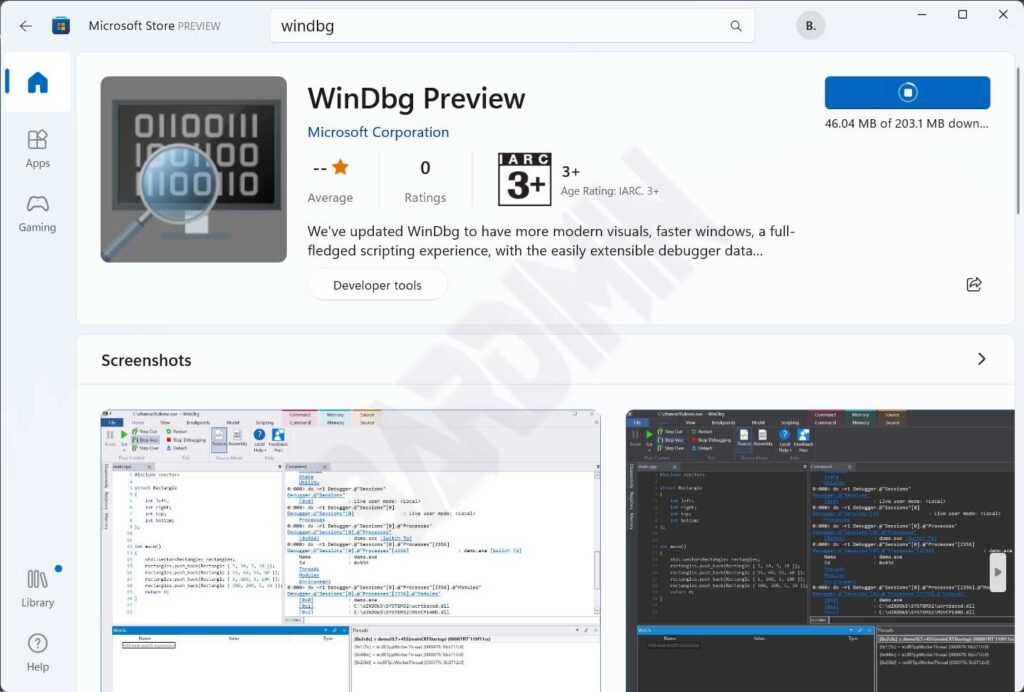
Windbg Preview is an official Microsoft utility for advanced debugging. The application is freely available via the Microsoft Store. Core features include symbol analysis, stack tracing, and register inspection. However, its interface may appear complex to beginners. Therefore, follow this step-by-step guide to begin your analysis.
- Download Windbg Preview from the Microsoft Store.
- Launch the application. Then click the File menu at the top.
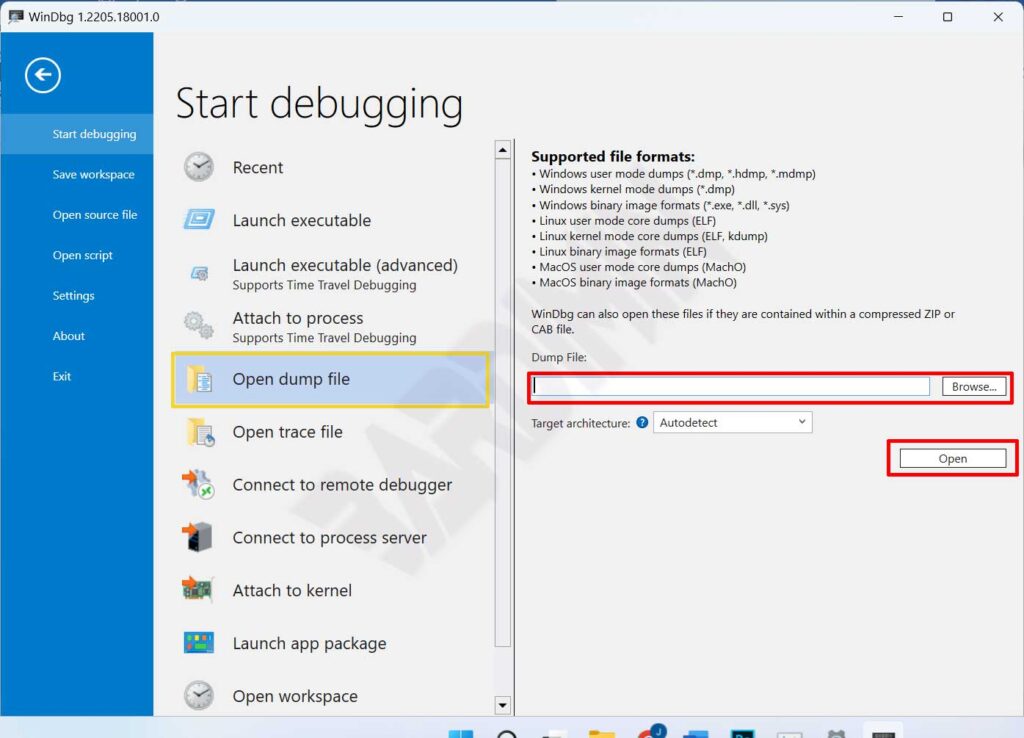
- Select “Start debugging > Open dump file“. Click “Browse” to locate your .dmp file.
- Navigate to C:\Windows\Minidump. Choose the most recent minidump file, then click “Open“.
- Windbg will load symbols and analyze the dump file. Wait until processing completes. Analysis results appear in the command panel below.
- Search for lines containing “BUGCHECK_STR” or “FAILURE_BUCKET_ID“. These entries indicate the probable crash cause.
Use the “!analyze -v” command in Windbg to obtain deeper, structured debugging insights and detailed error context.
Reading BSoD Minidump Files with BlueScreenView
BlueScreenView by Nirsoft provides a more accessible interface for beginners. The tool automatically scans all minidump files on your system. Results display in an intuitive, sortable table. Moreover, it highlights drivers potentially responsible for the crash. Thus, problem identification becomes faster and more intuitive.
- Download BlueScreenView from the official Nirsoft website.
- Extract the downloaded zip archive to your preferred folder.
- Run “BlueScreenView.exe“. The application will auto-load all detected crash entries.
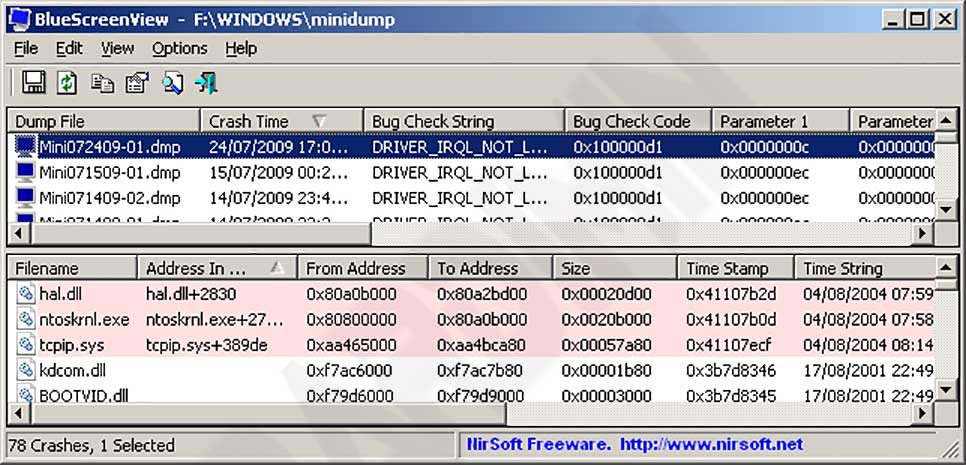
Each crash entry displays core information in the upper panel. Data includes timestamp, bug check code, and four parameters. The lower panel shows drivers loaded during the crash event. Suspect drivers appear highlighted in pink. Consequently, you can focus troubleshooting efforts on problematic components.
Practical tip: Always update hardware drivers periodically. Outdated drivers frequently trigger BSoD events. Moreover, use high-quality RAM modules to reduce crash risks significently.
Pro Tips for Professional Minidump Analysis
Reading BSoD minidump files demands a systematic methodology. First, ensure Windows symbol files are fully downloaded. Symbols help Windbg translate memory addresses into readable function names. Second, cross-reference analysis results with online error databases. Resources like Microsoft Learn offer bug check code documentation. Therefore, combining dedicated tools with external references accelerates troubleshooting workflows.
For gamers, also monitor overclocking settings and system temperatures. Unstable overclocking can induce random crashes. Use hardware monitoring utilities to track CPU and GPU thermal levels. If temperatures exceed safe thresholds, consider enhanced cooling solutions. Thus, system stability remains intact during intensive gaming marathons.
Finally, document every finding from your minidump analysis. Record error codes, implicated drivers, and applied fixes. This documentation proves valuable for future reference. Moreover, IT teams can share knowledge through these records. Consequently, overall system repair efficiency improves substantially.
Reading BSoD minidump files represents a core competency for IT professionals. Mastering Windbg Preview and BlueScreenView empowers you to diagnose errors independently. This proactive approach significantly reduces system downtime. Therefore, invest time in learning minidump analysis techniques. The outcome: more optimal and reliable Windows performance for your workflow.