A flowchart is a useful visual tool for illustrating processes, workflows, or logic. Flowcharts can help you understand, analyze, or improve a system. With Excel, you can create a Flowchart easily using SmartArt or Shape feature.
In this article, I will show you how to create a Flowchart with both features, as well as provide some tips and tricks to improve its appearance and functionality.
Create a Flowchart with SmartArt
SmartArt is a feature of Excel that allows you to create different types of charts and diagrams quickly and easily. One category of SmartArt is Process, which contains several Flowchart design options.
Here are the steps to create a Flowchart with SmartArt:
- Open the Excel worksheet to which you want to add a Flowchart.
- Click the Insert tab on the Ribbon.
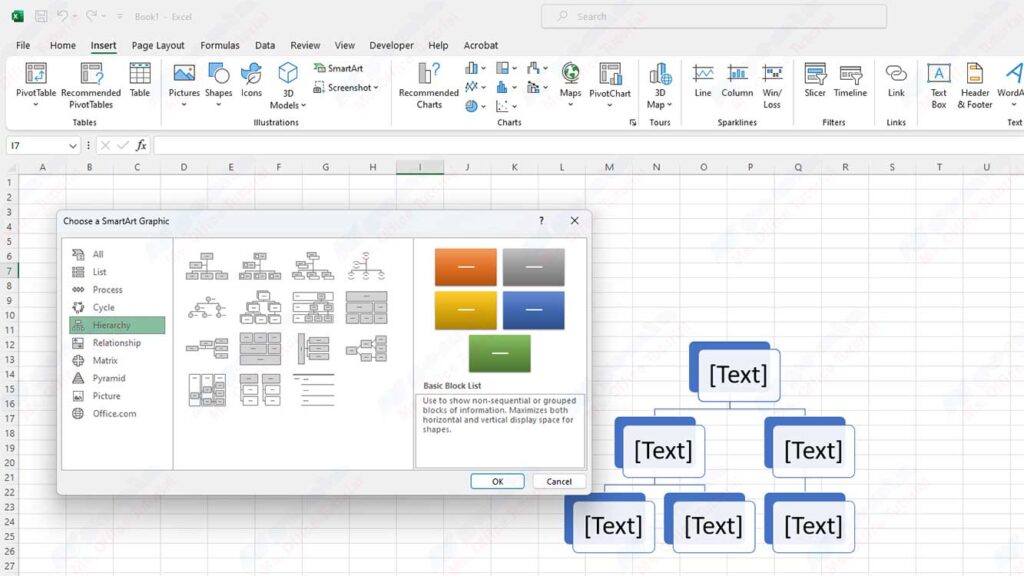
- Click the SmartArt button in the Illustrations group.
- In the Choose a SmartArt Graphic dialog box, select the Process category in the left pane.
- Select your preferred Flowchart design on the right pane. You can see a preview and a short description of each design by hovering over it.
- Click OK to insert a Flowchart into your worksheet.
- To add text to each shape on a Flowchart, click on the shape and type your text. You can also use the Text pane on the left of the Flowchart to edit the text.
- To add a new shape to a Flowchart, click on the shape you want to add afterward, and then click the Add Shape button on the Design tab under SmartArt Tools on Ribbon. You can choose to add a shape before, after, above, below, or next to the selected shape.
- To change the order of shapes on a Flowchart, click on the shape you want to move, and then click the Move Up or Move Down button on the Design tab under SmartArt Tools on the Ribbon. You can also drag and drop shapes to the position you want.
- To change the appearance of a Flowchart, you can use various options on the Design and Format tabs under SmartArt Tools on Ribbon. You can change the color, style, effect, size, and orientation of the Flowchart according to your needs.
Create a Flowchart with Shapes
Shape is a feature of Excel that lets you create and manipulate various geometric shapes and drawing objects. You can use Shapes to create Flowcharts more flexibly and creatively than SmartArt.
Here are the steps to create a Flowchart with Shapes:
- Open the Excel worksheet to which you want to add a Flowchart.
- Click the Insert tab on the Ribbon.
- Click the Shapes button in the Illustrations group.
- In the drop-down menu that appears, select the shape you want for your Flowchart. You can find some special shapes for Flowcharts under the Flowchart category.
- Click and drag on your worksheet to draw the shape. You can adjust the size and position of the shape by dragging the handles around the shape.
- Repeat steps 3-5 to add any other shapes you need to your flowchart.
- To add text to each shape, right-click on the shape and choose Add Text. Then, type your text inside the shape.
- To connect shapes on a Flowchart, you can use the Connector feature. Connectors are a special type of shape that can adjust to changes in the position and size of the shapes they connect. To add a Connector, click the Shapes button on the Insert tab of the Ribbon, and then select the type of Connector you want under the Lines category. Then, click on the connection point on the first shape you want to connect and drag it to the connection point on the second shape. You can adjust the shape and direction of the Connector by dragging the handles along the Connector.
- To change the appearance of a Flowchart, you can use various options on the Format tab under Drawing Tools on Ribbon. You can change the color, style, effect, size, and orientation of shapes and connectors according to your needs.
Conclusion
In this article, you have learned how to create a Flowchart with Excel using the SmartArt and Shape features. Both of these features have their advantages and disadvantages, so you can choose the one that best suits your goals and preferences.
A flowchart is a useful tool for visualizing processes, workflows, or logic. With Excel, you can create a Flowchart easily and quickly, and change it to suit your needs.