Power Pivot and Power Query are two great features in Microsoft Excel that help users in more in-depth and efficient data analysis.
Power Pivot allows users to create more complex data models and simplifies the management of big data by using Data Model in Excel. This feature helps connect various data sources and allows analysis using DAX (Data Analysis Expressions) for more complex measurements and calculations.
Power Query is a tool for importing, cleaning, and transforming data (ETL – Extract, Transform, Load). With Power Query, you can easily import data from multiple sources, clean it up in a simpler way, as well as combine data from multiple files or databases in a single step.
In the ever-evolving era of Business Intelligence (BI), the ability to analyze data quickly and accurately is essential. Many organizations now rely on Power Pivot and Power Query to make better, more informative data-driven decisions.
Limitations of Traditional Microsoft Excel
Microsoft Excel is a useful tool for data analysis, but it has some important limitations, especially when used to manage large amounts of data or complex analysis. Here are some of the key limitations of traditional Microsoft Excel:
1. Data Scalability Limitations
One of the main problems with Excel is scalability. Although Excel can handle up to 1,048,576 rows in a single worksheet, when the data starts to exceed this limit, users will have a hard time.
The data processing process becomes slow, and calculations can take a long time, even for simple tasks. When a workbook becomes too large and complicated, users may need to split the data into multiple worksheets or workbooks, which can lead to confusion and increase the risk of errors.
2. Lack of Clarity in the Analysis Process
Excel often creates complex systems of analysis with many interrelated formulas, cell references, and macros. This can make the analysis process difficult to understand, especially for others who are not familiar with the workbook.
When one has to work with spreadsheets created by others, one often has trouble navigating the logic behind calculations and relationships between data. This lack of clarity can lead to errors in analysis and decision-making.
3. Data Merger and Presentation Issues
In Excel, data and presentation are often mixed. For example, a user might have multiple worksheets for each month that contain formulas and summaries. When asked to provide a quarterly summary, users have to add formulas and create new settings, which can lead to confusion and inconsistencies. This shows that the data is not well separated from its presentation, making it difficult to further analyze without damaging the existing structure.
Power Pivot and Power Query benefits
Microsoft Excel is now a more sophisticated tool thanks to the existence of Power Pivot and Power Query. Both of these features are designed to overcome the old limitations of Excel and provide a solution for more complex data analysis. Here are the main advantages of each of these tools:
Power Pivot for Deeper Data Analysis
1. Managing Big Data Without Line Limitations
One of the main advantages of Power Pivot is its ability to handle large data that exceeds the limit of 1,048,576 rows on a regular Excel worksheet. Power Pivot uses a Data Model, which allows you to load millions of rows of data from various sources, such as SQL databases, CSVs, or ERP systems, without disrupting the performance of Excel files.
You can import five years of sales transaction data from different branches of the company without the need to break down files or limit analysis.
2. Creating a Relational Data Model
With Power Pivot, you can create a relational data model, which allows you to connect various tables based on key columns without having to combine them into a single table like in traditional Excel. This makes it easy to analyze complex data, such as comparing sales data with targets or analyzing the relationship between customers and products.
You can connect the “Sales”, “Customers”, and “Products” tables to analyze purchasing patterns without the need to combine them in a single table.
3. Analysis Using DAX (Data Analysis Expressions)
DAX is an advanced formula language in Power Pivot that allows you to create custom calculations such as profit measurements, ratios, or growth trends. DAX provides much greater flexibility than regular Excel formulas.
Power Query for Data Processing
1. Easy to Clean and Change Data
Power Query allows users to retrieve data from various sources, such as Excel files, CSVs, databases, or web APIs, and clean it up without the need to write complicated code. With an easy-to-understand interface, you can delete the same data, change the format of columns, separate text data, or combine columns with just a few clicks.
You can retrieve customer data from two different Excel files, delete the same data, and change the format of the “Date of Birth” column to a standard format.
2. ETL (Extract, Transform, Load) Process Automation
One of the key features of Power Query is its ability to automate ETL processes. Once you create queries to retrieve, clean, and modify data, the process can be saved and re-run at any time without the need for manual work. This increases efficiency, especially when you’re working with frequently updated data.
If you need to retrieve weekly sales reports from a CSV file, Power Query can automatically combine all the files, clean the data, and present them in a ready-to-use format with just one click.
Steps to Get Started with Power Pivot
Power Pivot is a great tool in Microsoft Excel that helps users perform more in-depth data analysis. Here’s how to get started with Power Pivot, including how to install, set up, and create a data model and pivot table.
1. Initial Installation and Setup
Make sure you’re using a version of Microsoft Excel that supports Power Pivot. Power Pivot is available in Excel 2010 (Professional Plus version) and all versions of Excel 2013 and above.
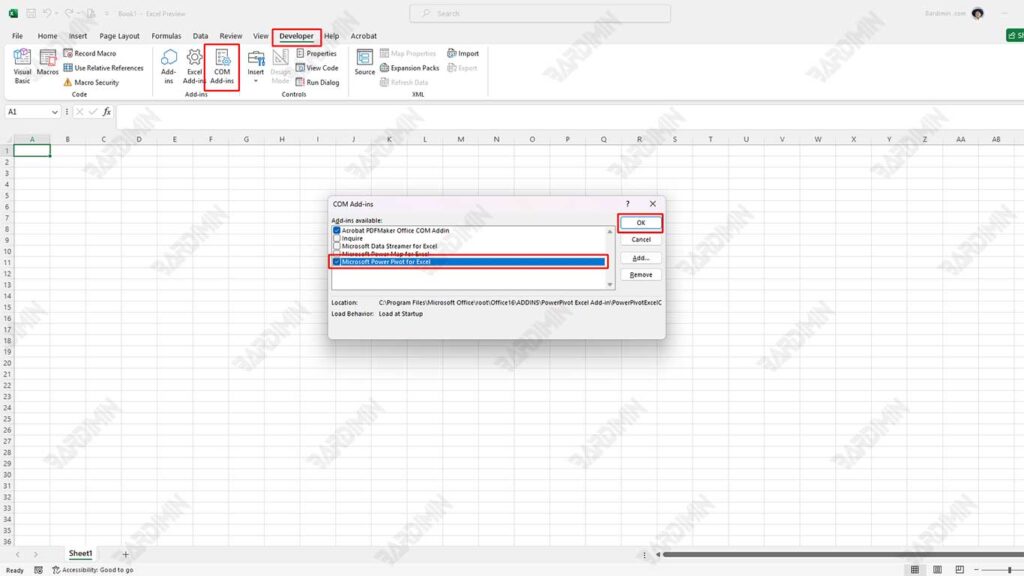
Enable Power Pivot:
- Open Excel, and click the Developer tab.
- In parts Add-Ins,
- In the Excel Options window, select Add-Ins.
- Then click COM Add-ins.
- Check the box for Microsoft Office Power Pivot and click OK. After that, the Power Pivot tab will appear in the Excel ribbon.
2. Create Your First Data Model with Power Pivot
Data Import:
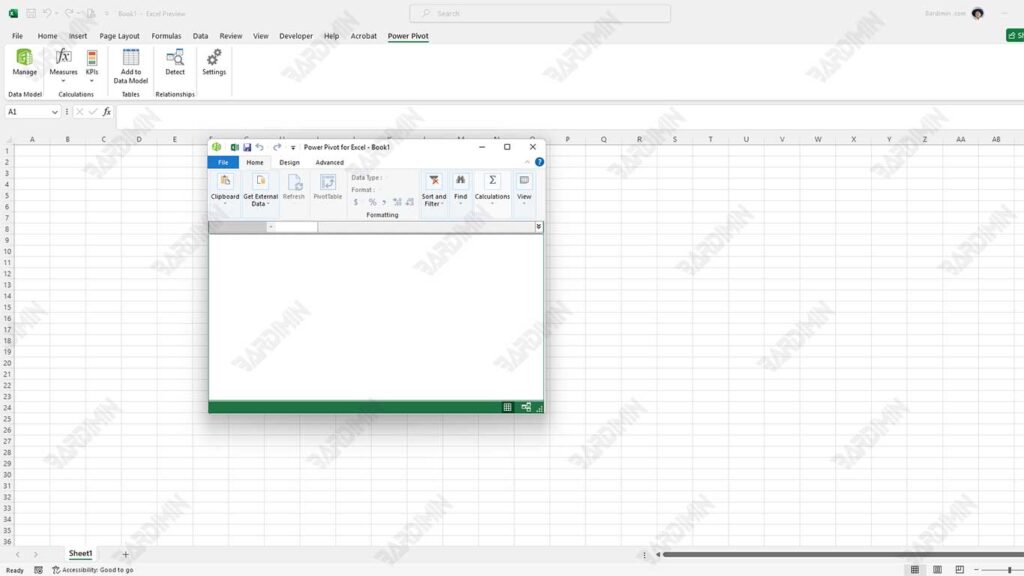
- Click the Power Pivot tab, and then select Manage to open the Power Pivot window.
- In this window, click Get External Data and select the data source you want to use (for example, from an Excel file, an SQL Server database, or another source).
Creating Relationships Between Tables:
- After importing data from different sources, you can create relationships between tables by selecting the Diagram View tab in the Power Pivot window.
- Drag and drop key columns from one table to key columns in another table to assign relationships. This allows for more complex data analysis by utilizing relational models.
3. Creating a Pivot Table from a Data Model
Creating a Pivot Table:
- Return to Excel after setting up the data model in Power Pivot.
- Select the Insert tab, then click PivotTable.
- In the window that appears, select the option to use the data model from Power Pivot and click OK.
Adding Fields to a Pivot Table:
- In the pivot table field pane that appears, you’ll see the tables and columns from your data model.
- Drag the desired fields to the Rows, Columns, or Values area to create your analysis report.
Steps to Get Started with Power Query
Power Query is a very useful tool in Microsoft Excel for importing, cleaning, and transforming data from various sources. Here are the steps to get started with Power Query, including how to import data, make changes, and specific examples.
1. Importing Data from Multiple Sources
Open Power Query:
- In Excel, select the Data tab at the top.
- Click Get Data to view a wide selection of data sources.
Select a Data Source:
- You can import data from a variety of sources, such as:
- File: Excel, CSV, XML, JSON
- Database: SQL Server, Access, Oracle
- Online Services: SharePoint, Web
- Select the appropriate source and follow the instructions to connect to that data source.
Making Connections:
- After selecting the data source, Power Query opens a Navigator window. Here, you can select the table or data range you want to import.
- Click Load to load the data directly into the worksheet or Transform Data to open the Power Query editor and perform any further cleanups or changes before loading it.
2. Transform Data Using Features in Power Query
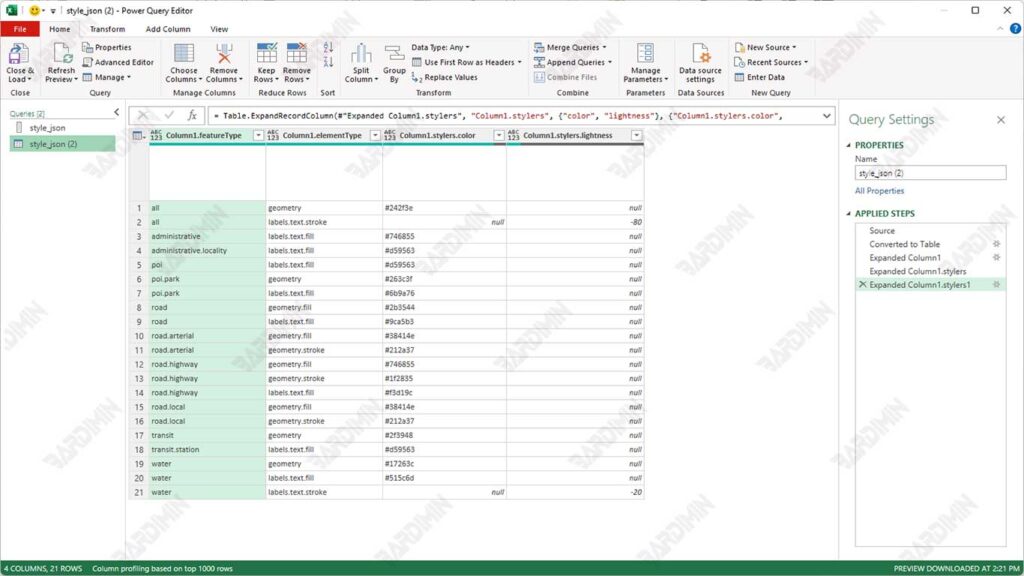
Power Query Editor:
- After selecting Transform Data, you’ll be taken to the Power Query editor. Here, you can make various changes such as:
- Delete Columns: Select the columns you don’t need and right-click to delete them.
- Replacing Values: Use the “Replace Values” feature to replace certain values with others.
- Merge Tables: If you have multiple tables that you want to merge, use the “Merge Queries” option to merge by key columns.
Implementing the Change:
Each step of the change you make will be recorded in the right panel. You can add a new step or edit an existing step at any time.
3. Example: Changing Date Format and Cleaning Data
Changing the Date Format:
- If you have a date column in text and want to change it to the correct date format:
- Select the date column in the Power Query editor.
- On the Transform tab, select Data Type, and then select Date. This will convert the column to the appropriate date format.
Cleaning Data:
- To remove an empty or duplicate value from the data:
- Use the “Remove Rows” option to remove the blank rows.
- To remove duplicates, select the required columns and click on the “Remove Duplicates” option.
Integration Between Power Pivot and Power Query
Power Pivot and Power Query are two tools that support each other in Microsoft Excel. When used together, they provide the ability to manage big data, clean data, and perform in-depth analysis with high efficiency. Power Query serves to prepare data, while Power Pivot is used to build more complex relational and analytical data models.
1. Using Power Query to Prepare and Clean Data
The first step is to import and transform the data using Power Query. This includes processes such as cleaning data, merging tables, and changing data formats.
Once the data is ready, the results from Power Query are fed into the Data Model used by Power Pivot.
Steps:
- Click the Data tab, and then select Get Data to open the Power Query Editor.
- Pull data from multiple sources (Excel files, databases, or APIs).
- Clean the data as needed (for example: remove duplicates, and change data types).
- When you’re done, click Close & Load To, then select the Add this data to the Data Model option. This will save the results of the transformation into a Data Model that can be accessed in Power Pivot.
2. Using Power Pivot to Build Relational Data Models
Once the data has been entered into the Data Model, you can use the Power Pivot to create relationships between tables, add calculated columns, and perform advanced analysis with DAX (Data Analysis Expressions).
Steps:
- Click the Power Pivot tab and select Manage.
- You’ll see the data that has already been loaded from Power Query to the Data Model.
- If there is more than one table, use Diagram View to connect tables based on key columns (such as Product ID or Customer ID).
- Use DAX to add new columns or measures.