Microsoft Network Monitor is a legacy network packet analyzer tool from Microsoft that has reached the end of its development lifecycle. This article provides an in-depth technical guide on its architecture, packet capture methods, and the implementation of its specific filter language for precise network diagnosis, along with the context of its modern replacements.
Microsoft Network Monitor (often called NetMon) is a proprietary packet analyzer application developed by Microsoft for Windows operating systems. It functions as a protocol analyzer and network sniffer capable of capturing, decoding, displaying, and analyzing data frames traversing a network interface. Technically, it operates at the Data Link (Layer 2) and Network (Layer 3) layers of the OSI model, allowing inspection of headers and payloads from various protocols like Ethernet, IPv4/IPv6, TCP, UDP, and application protocols. However, it is crucial to note that Microsoft announced the end-of-life for this tool and removed it from official distribution around 2016. Its successor, the Microsoft Message Analyzer, has also been archived.
Architecture and Installation Guide
Microsoft Network Monitor 3.4 is built on a dedicated Network Monitor Driver that must be installed. This driver enables the user-mode application to capture packets in promiscuous mode, a mode where the network adapter can receive all traffic on the network segment, regardless of whether the packet is intended for that adapter’s MAC address. Here is the technical installation procedure:
- Binary Download: Download the installation package (
NM34_x64.exeorNM34_x86.exe) from a trusted third-party archive, as the official Microsoft link is no longer active. Ensure you verify the file hash (MD5/SHA1) if provided to confirm binary integrity. - Installation and Driver Setup: Run the installer with administrator privileges. This process will install the application itself along with the Network Monitor Driver. You may see prompts from Windows User Account Control (UAC) and Windows Security to install an unsigned driver, depending on system policy.
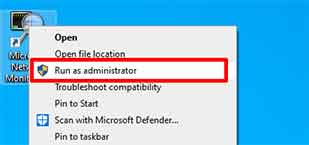
- Execution with Privileges: After installation, always run the “Microsoft Network Monitor 3.4” application with the “Run as administrator” option. This is crucial because the capture process requires kernel-level access through the driver. Without this privilege, capture and process analysis features will not function.
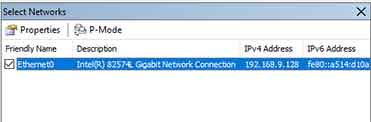
- Network Adapter Selection: In the top-left panel, check only one network adapter to be the capture source. Selecting more than one adapter can cause significant CPU overhead and mix frames from different network segments, complicating analysis. Choose the adapter corresponding to the Network Interface Card (NIC) connected to the target segment.
Capture Methodology and Frame Analysis
The core process of Microsoft Network Monitor involves capturing and interpreting network frames. Each captured frame is analyzed based on built-in protocol parsers. Here is the technical workflow:
- Capture Session Initiation: Click the “New Capture” button (the new page icon) then the “Start” button (the green triangle icon). Internally, the application initiates a capture session with the driver, allocating a ring memory buffer in RAM to temporarily store frames before writing to disk (if configured).
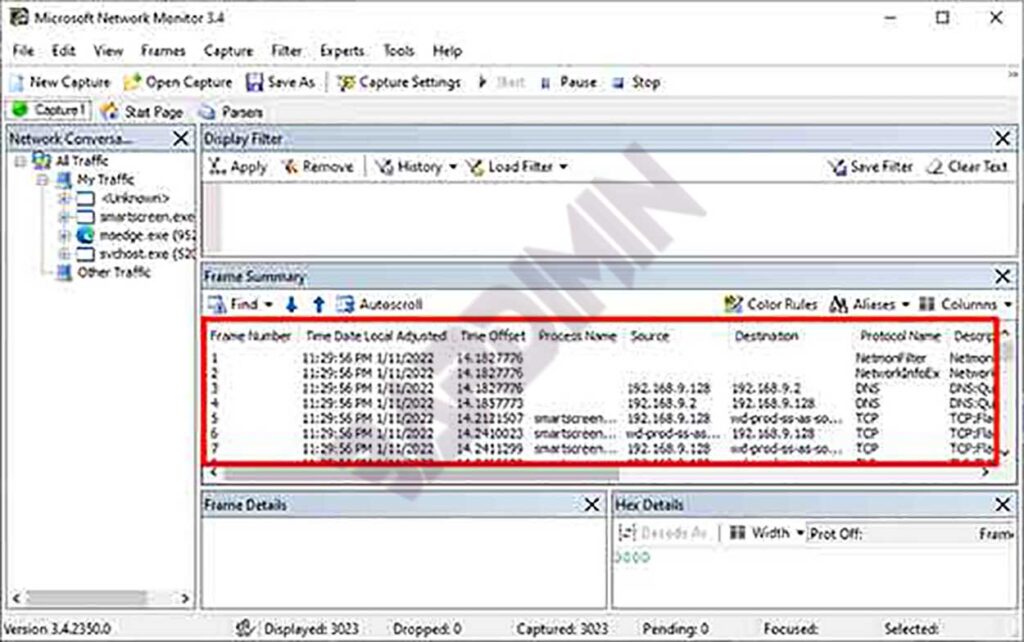
- Data Interpretation in the Frame Summary Panel: Each row in the “Frame Summary” panel represents one frame. Important columns include:
- Frame Number: Sequential frame number since the session started.
- Time Offset: Time delta since the first captured frame.
- Src MAC Addr & Dst MAC Addr: Data Link layer addresses.
- Protocol: The highest-layer protocol successfully identified in the frame (e.g., TCP, HTTP, DNS).
- Description: Human-readable summary of the frame content, generated by the parser.
- Deep Packet Inspection in the Frame Details Panel: Click on a frame row to see in-depth analysis in the bottom panel. This panel uses a hierarchical tree-view showing the frame decomposition per protocol layer (e.g., Ethernet Header, IP Header, TCP Header, HTTP Payload). This is where technical troubleshooting such as analyzing TCP flags, TTL values, checksum errors, or three-way handshake sequences is performed.
- Applying Filters for Specific Analysis: Use the “Filter” box above the Frame Summary panel to filter thousands of frames based on very specific technical criteria. These filters use the powerful Network Monitor Parsing Language (NPL).
Implementing NPL Filter Language for Diagnosis
The main analytical strength of Microsoft Network Monitor lies in the Network Monitor Parsing Language (NPL). This is a Boolean expression language that allows constructing filters based on fields in protocol headers or calculated properties. Understanding NPL syntax is essential for problem isolation.
IP and Transport Layer Filters
| Field/Property | Technical Description & Use Case | Example NPL Syntax |
|---|---|---|
IPv4.Address | Matches an IPv4 address as either source OR destination. Useful for monitoring all activity of a host. | IPv4.Address == 192.168.1.10 |
IPv4.SourceAddress | Specific to the packet source address. For tracking traffic sent by a particular host. | IPv4.SourceAddress == 10.0.0.5 |
TCP.Port | Matches a TCP port number as either source OR destination. Essential for filtering specific services (port 443 for HTTPS, 3389 for RDP). | TCP.Port == 443 |
TCP.Flags | Checks combinations of TCP flags. Analyze connection patterns (SYN for initiation, RST for forced reset, FIN for graceful termination). | TCP.Flags.Syn == 1 && TCP.Flags.Ack == 0 (pure SYN packets only) |
Property.TCPRetransmit | Property set to 1 if detected as a TCP retransmission. A primary indicator of packet loss, congestion, or high RTT. | Property.TCPRetransmit == 1 |
For example, to diagnose slow connections to a web server, you can combine filters:
// Filter to capture TCP retransmissions destined for web server 203.0.113.5 on port 80
IPv4.DestinationAddress == 203.0.113.5 && TCP.Port == 80 && Property.TCPRetransmit == 1
Application Process-Based Filters
A unique feature of NetMon is its ability to correlate network traffic with the Process ID (PID) and Process Name that generated or received the traffic. This is achieved through integration with the Windows Networking API. These filters are very useful for identifying which application is consuming bandwidth.
| Property | Description | Example |
|---|---|---|
Property.ProcessName | The image file name of the process (e.g., chrome.exe, svchost.exe). Search is case-insensitive. | Property.ProcessName.Contains("chrome") |
Property.ProcessId | The numerical process ID. Useful if there are multiple instances of the same application. | Property.ProcessId == 4512 |
Specific Protocol Filters and Complex Examples
For deeper diagnosis, you can create filters targeting specific protocol behavior. Here are examples for analyzing DNS issues or failed connections:
// 1. Filter to capture only DNS query and response packets
DNS

// 2. Filter to capture TCP conversations that failed the three-way handshake
// (Detects SYN packet followed by RST, without SYN-ACK)
TCP.Flags.Syn == 1 && TCP.Flags.Ack == 0 && TCP.Flags.Rst == 1

// 3. Filter to capture HTTP traffic containing a specific keyword in the URI
HTTP.Request.URI.Contains("login")
Conclusion and Recommendations for Modern Environments
As an obsolete tool, Microsoft Network Monitor still holds educational value for understanding the basic principles of packet analysis and protocol decoding in Windows environments. Its strengths lie in good integration with the Windows networking stack and process-based filtering capabilities. However, for modern professional, technical, and security audit purposes, its lack of updates, absence of support for newer protocols (like HTTP/2, QUIC), and inactive community make it a less ideal choice.
A practical recommendation is to migrate to Wireshark, the de facto standard for network analysis. Wireshark offers much broader protocol support, highly expressive filtering capabilities (Berkeley Packet Filter and Wireshark Display Filters), a large community, and regular security updates. The in-depth understanding of concepts gained from studying Microsoft Network Monitor, such as reading hex dumps and header structures, can be directly transferred and form a solid foundation for using more modern packet analysis tools.