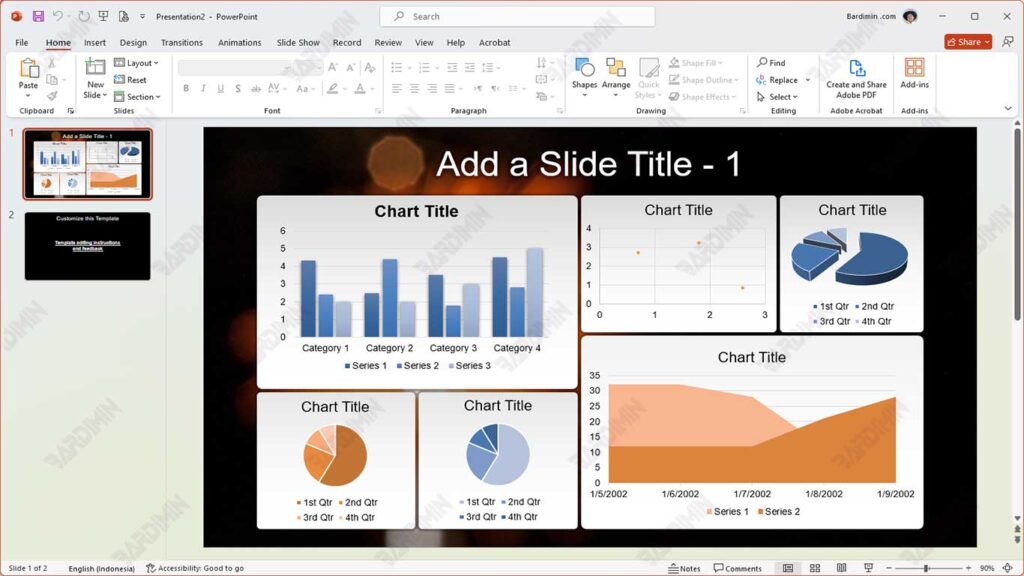
In the business and academic worlds, a good presentation relies heavily on presenting data in a way that is easy to understand. Data visualization has an important role to play in this regard. With graphs, diagrams, and charts, you can simplify complex information into something more engaging and easy for your audience to understand.
Charts not only make the presentation more engaging but also help the audience understand the trends, patterns, and insights from the data presented. For example, a line chart can show the progress of sales over time, while a bar chart can compare the performance of different products. By connecting the graph directly from Excel to PowerPoint, you ensure that the data displayed is always accurate and up-to-date.
1. Prepare Data and Graphs in Excel
The first step to connecting charts from Excel to PowerPoint is to prepare the data to be used. Make sure the data is well organized in the table. For example, if you want to create a sales chart, create a table with columns for the date, product, and number of sales. Once the table is ready, follow these steps to create the chart:
- Block all the data you want to graph, including column titles.
- Click on the “Insert” tab in the Excel menu bar.
- Choose a chart type that matches your data, such as Column Chart, Line Chart, or Pie Chart.
After selecting a chart type, Excel will automatically create a chart based on the data you selected.
Before proceeding to PowerPoint, make sure that the graphics created are suitable for the presentation needs. Check the following:
- Adjust the color, style, and size of the graphics to make them attractive and easy to read.
- Make sure the graph has a clear title and informative axis labels to help the audience understand the data.
- Double-check that all data in the graph is accurate and relevant.
2. Method of Connecting Charts from Excel to PowerPoint
a. Copy and Paste Method
One of the most convenient ways to connect charts from Excel to PowerPoint is with the Copy and Paste method. This method is very practical and fast, ideal for users who need a quick solution without much setup.
Steps:
- Open the Excel file and select the chart you want to insert. Make sure that the chart you created in Excel is ready and formatted properly.
- After selecting a graph, press the Ctrl + C key combination on your keyboard to copy the graph.
- Open your PowerPoint file and select the slide where you want to place the graphic.
- Press Ctrl + V to paste the chart you have copied from Excel into a PowerPoint slide.
Pros:
It’s quick and easy to do. This method is very simple and requires no additional settings, making it ideal for users who want to add graphics to a presentation right away.
Once you’ve pasted the graphic, you can make further edits directly in PowerPoint, such as resizing, positioning, or styling the graphic to suit your presentation’s needs.
Cons:
One of the major drawbacks of this method is that the inserted graph is not connected to the original data in Excel. If there are changes to the data in Excel, the chart in PowerPoint won’t update automatically.
If the data in Excel is updated after the graph is copied to PowerPoint, there is a risk that the information displayed in the graph is no longer accurate or consistent with the most recent data, which can confuse the audience.
b. Method of Inserting as a Linked Object
This method is a good way to make sure the charts in PowerPoint always get the latest data from Excel. This way, you can keep the data displayed in the presentation as the original data in the Excel file.
Steps:
- Open the Excel file and select the chart you want to paste into PowerPoint. After that, press Ctrl + C to copy it.
- Open the PowerPoint presentation and locate the slide where you want to place the graph.
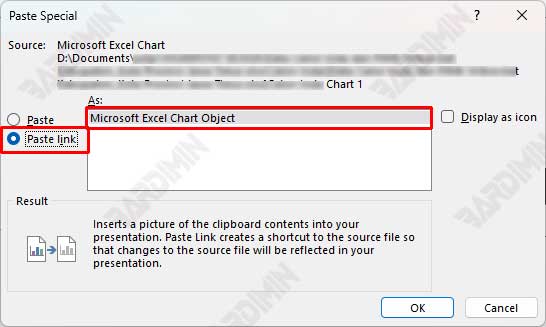
- Once you are on the desired slide, click the “Paste” button in the “Home” tab. Select “Paste Special…” from the menu that appears.
- In the Paste Special dialog box, select “Paste link” and then select “Microsoft Excel Chart Object”. This will insert the graph as a linked object, so any changes in Excel will automatically be visible in PowerPoint.
Pros:
This way, whenever there is a change in the Excel file, the chart in PowerPoint will be automatically updated without the need to copy it again.
Graphics inserted as linked objects still have good visual quality, so they look professional in presentations.
Cons:
To perform the update, you must have access to the Excel file that holds the original data. Without the file, updating the graphics cannot be performed.
One of the risks of this is that if the Excel file is moved elsewhere or renamed, the link between the PowerPoint and the Excel file will be broken, so the chart can no longer be updated.
c. Method of Inserting as Embedded Object
The Insert as Embedded Object method is another way to connect charts from Excel to PowerPoint. Unlike the Linked Object method, this method embeds Excel charts and data directly into a PowerPoint file. This makes your presentation more self-contained because it doesn’t require a separate Excel file during the presentation. However, this method also has some drawbacks that need to be noted.
Steps:
- Open the Excel file and select the chart you want to insert. After that, press Ctrl + C to copy it.
- Open the PowerPoint presentation and locate the slide where you want to place the graph.
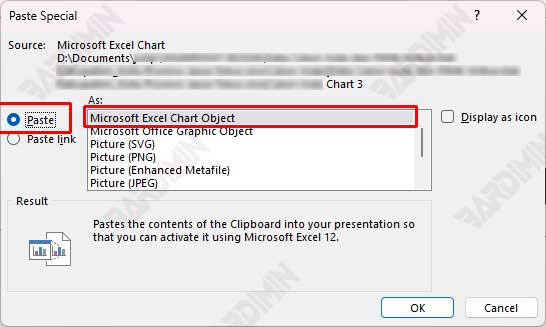
- Once you are on the desired slide, click the “Paste” button in the “Home” tab. Select “Paste Special…” from the menu that appears.
- In the Paste Special dialog box, select “Paste” and then select “Microsoft Excel Chart Object”. This will embed the graph into the presentation so that the data is saved directly in the PowerPoint file.
Pros:
This way, you don’t have to worry about the presence of Excel files during presentations, as all the data is already in the PowerPoint file.
If you need to change the chart data, simply double-click on the chart in PowerPoint to open the Excel interface and make live edits.
Cons:
Because data from Excel is embedded directly into the PowerPoint file, the size of the presentation file can increase significantly, especially if the graphics used have a lot of data or high complexity.
One of the main drawbacks of this method is that if there are changes to the original data in Excel after the graph has been embedded, the update will not be reflected automatically in PowerPoint. You must manually edit the chart to update the information displayed.
Tips for Effective Graphics Integration
Combining charts from Excel to PowerPoint in the right way can improve the quality of your presentations. Here are some tips to make sure your graphics integration goes well:
1. Save Files in the Same Place
For the Linked Object method, it is important to store the Excel and PowerPoint files in the same location. If an Excel file is moved or renamed, the link between the graph and the data may be lost. So, keep both files in the same folder or use a fixed path to avoid problems.
2. Use Clear File Names
Give your Excel and PowerPoint files a descriptive and easy-to-understand name. A clear name will help in identification and avoid confusion, especially if you are working with a lot of files. For example, use a name like “Sales_report_Q1_2025.xlsx” for an Excel file.
3. Check Links Regularly
Before the presentation, make sure that all chart links are functional and display the most recent data. Go to each slide that contains the graph and check that the data is displayed correctly. If there are any problems, you can fix them before the presentation starts so that your audience doesn’t get confused by the wrong information.
4. Consider the File Size
If presentation file size is an issue, use the Linked Object method instead of Embedded Object. The linked method usually results in a smaller file size because it only stores the link to the original data in Excel, instead of storing all the data in a PowerPoint file. This is especially useful if you have a lot of graphs or large data that needs to be entered.